You are an experimental biologists without programming skills and would like to easily perform popular Visualization Analysis and get publication-ready figures?
Search no more: Here is GraphBio, a shiny web app by Tianxin Zhao and Zelin Wang to easily perform popular visualization analysis for omics data.
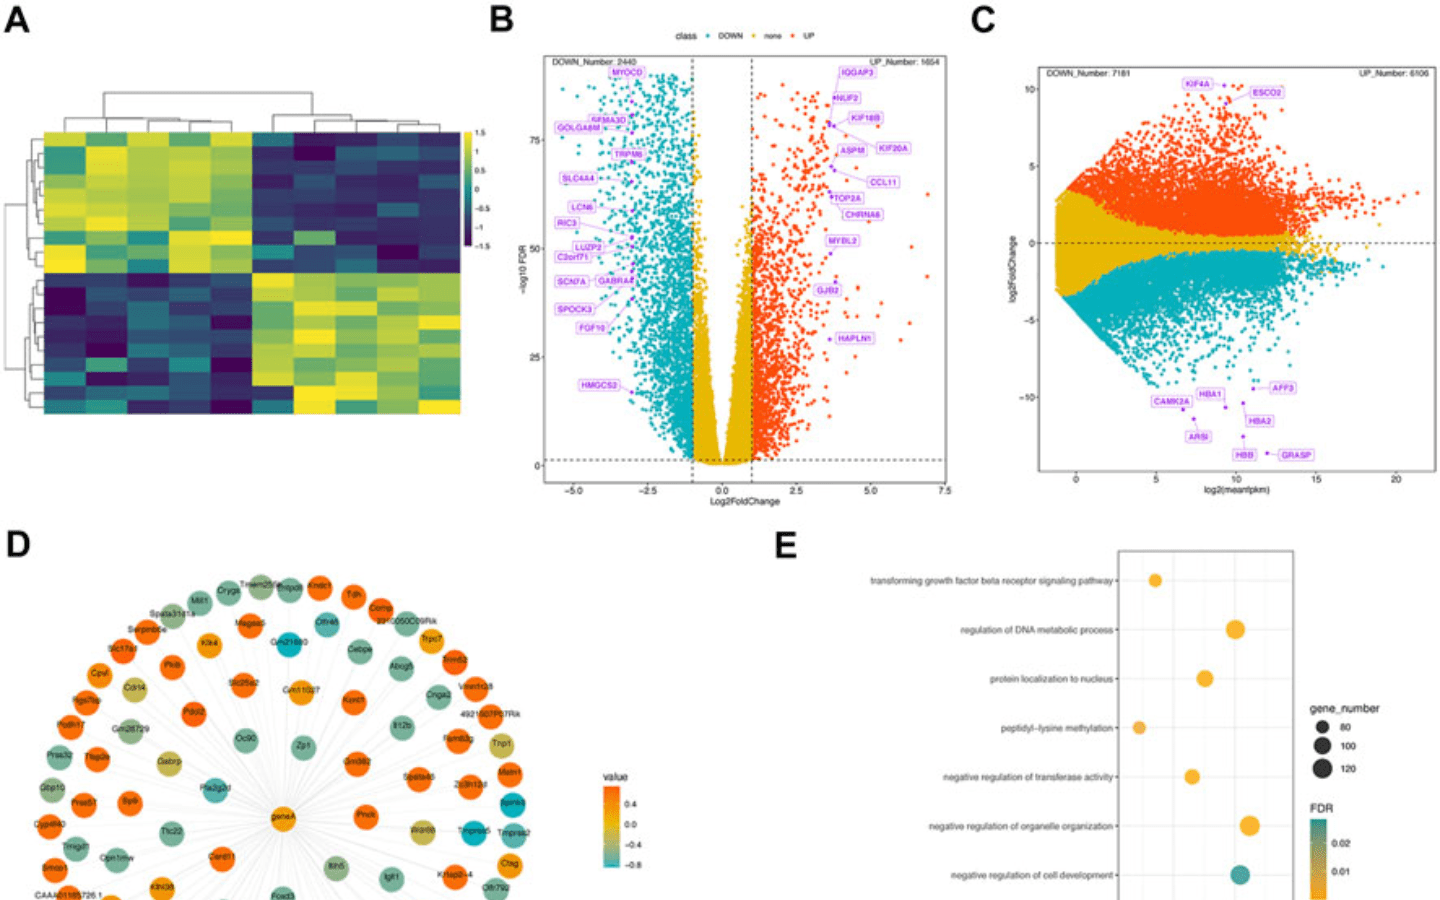
GraphBio provides 15 popular visualization analysis methods such as: heatmap, volcano plots, MA plots, network plots, dot plots, chord plots, pie plots, four quadrant diagrams, Venn diagrams, cumulative distribution curves, principal component analysis (PCA), survival analysis, receiver operating characteristic (ROC) analysis, correlation analysis, and text cluster analysis.
You can click below in order to start using this tool:
Please note:
This action will also remove this member from your connections and send a report to the site admin.
Please allow a few minutes for this process to complete.